

ESC or click to close
|
Press releases and reports
Attitude of the residents of Ukraine to the independence of Ukraine (May 2018)
Press release by Yulia Sakhno
On May 18-30, 2018, Kyiv International Institute of Sociology (KIIS) conducted an all-Ukrainian public opinion poll. Data were collected from 2025 respondents living in 108 settlements in all oblasts of Ukraine (except for the AR of Crimea) with the method of computer-assisted personal interviews (CAPI). The sample was stochastic, and it is representative of the population of Ukraine aged 18 and above. In Luhansk and Donetsk oblasts survey was conducted only in the territories that are controlled by the Ukrainian government. The statistical sampling error (with a probability of 0.95 and for a design effect of 1.5) does not exceed: 3.3% — for indexes close to 50%, 2.8% — for indexes close to 25%, 2.0% — for indexes close to 10%, 1.4% — for indexes close to 5%.
In order to monitor the attitude of the population to the state independence, KIIS asks the respondents how they would vote if a referendum on the proclamation of Ukraine's independence was held nowadays. According to the results of this year's poll, if the referendum on Ukraine's independence had been held in May 2018, 66% of the population of Ukraine[1] would have voted for the independence, 12% - would have voted against, and 21% - would not have voted or would not have participated in the referendum. That is, if the referendum on Ukraine's independence had been held in May 2018, and those who had not decided how to vote yet, had not, as usual, come to a referendum, 79% of the population would have participated in the referendum and 84% of them would have voted for the independence of Ukraine, 16% - against. [1] Residents of Ukraine without the temporarily occupied territories (the AR of Crimea, parts of Donetsk and Luhansk oblasts)  Over the past year, support for Ukraine's independence has slightly decreased (from 70% to 66% or from 90% to 84% of votes “for”) and returned to the level registered in 2016. 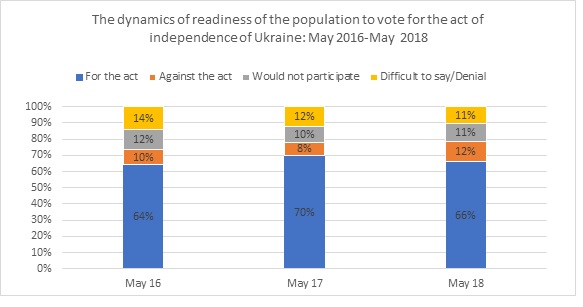 The percentage of those who would have voted for Ukraine's independence is slightly higher among young people (under 40 years old) than among the elderly, but this difference is not very big: among the residents under 40 years about 73% were ready to vote for the independence, 8% - against, 20% - not determined; among those older than 40 years 62% - for, 15% - against, 23% - not determined.  The level of support for state independence is higher in the Western and Central regions than in the Southern and Eastern parts of the country but in all regions the proportion of those who would have voted for Ukraine's independence significantly exceed the proportion of those who would have voted against. If the referendum on Ukraine's independence had been held in May 2018:

Commentary of V.Paniotto As mentioned before, the percentage of those who would have voted for Ukraine's independence on the referendum fell slightly (from 70% to 66% of the population, or from 90% to 84% of the vote) over the past year, returning to the level of 2016. What can this be related to? Our data show that, in general, the situation in Ukraine on the main social indicators is improving, although the pace of improvement is not very high (for example, the levels of well-being, happiness, health are rising, poverty is decreasing), Also, there is a positive dynamics behind other indicators (see press-release: "Ukrainian society over the 25 years: dynamics of some social indices") Meanwhile, the majority of the population believes that the situation is not improving, but rather is deteriorating. One can express the hypothesis that this is due to the continuation of the information war, the approaching elections and the intensification of political struggle which brings the increase in mutual criticism of politicians and criticism of power. The attitude and behavior of people depend not only (and often not so much) on the real situation, but on the perception of it, therefore some people underestimate positive tendencies and believes that the situation is worsening, and this situationally affects the attitude to the independence of Ukraine.
ADDITION. Tables Table 1. “On August 24, 1991, the Ukrainian Parliament declared complete independence. The population of Ukraine expressed their attitude to the Independence Act at a referendum that was held on December 1, 1991. If the referendum took place today, how would you vote?”, %
The data are given for Ukraine except for the temporarily occupied territories (without the AR of Crimea and the parts of Donetska and Luhanska oblasts). Table 2. “On August 24, 1991, the Ukrainian Parliament declared complete independence. The population of Ukraine expressed their attitude to the Independence Act at a referendum that was held on December 1, 1991. If the referendum took place today, how would you vote?” – May 2018, distribution by age groups, %
The data are given for Ukraine except for the temporarily occupied territories (without the AR of Crimea and the parts of Donetska and Luhanska oblasts). Table 3. “On August 24, 1991, the Ukrainian Parliament declared complete independence. The population of Ukraine expressed their attitude to the Independence Act at a referendum that was held on December 1, 1991. If the referendum took place today, how would you vote?” – May 2018, distribution by regions, %
The data are given for Ukraine except for the temporarily occupied territories (without the AR of Crimea and parts of Donetska and Luhanska oblasts). Western region: Volynska, Zakarpatska, Ivano-Frankivska, Lvivska, Rivnenska, Ternopilska, Khmelnytska, Chernivets`ka oblasts; Central region: Kyiv city, Kyivs`ka, Vinnytska, Zhytomyrska, Kirovohradska, Poltavska, Sumska, Cherkaska, Chernihivska oblasts; South region: Dnipropetrovska, Zaporizka, Mykolaivska, Odeska, Khersonska oblasts; Eastern region: Kharkivska, Donetska, Luhanska oblasts (without the temporarily occupied territories). [1] Residents of Ukraine without the temporarily occupied territories (the AR of Crimea, parts of Donetsk and Luhansk oblasts)
27.8.2018
|
Our social media:
 KIIS page
 KIIS channel