

ESC or click to close
|
Press releases and reports
Interethnic prejudice in Ukraine: September-October 2025
The press release was prepared by Volodymyr Paniotto, President of KIIS
From September 19 to October 5, 2025, the Kyiv International Institute of Sociology (KIIS) conducted its own all-Ukrainian public opinion survey "Omnibus", to which, on its own initiative, added questions about attitudes towards certain ethnic groups according to the Bogardus social distance scale. By the method of telephone interviews (computer-assisted telephone interviews, CATI) based on a random sample of mobile phone numbers (with random generation of phone numbers and subsequent statistical weighting) in all regions of Ukraine (the territory controlled by the Government of Ukraine), 1,008 respondents were surveyed. The survey was conducted with adult (aged 18 and older) citizens of Ukraine who, at the time of the survey, lived in the territory of Ukraine controlled by the Government of Ukraine. The sample did not include residents of territories temporarily not controlled by the Ukrainian authorities (at the same time, some of the respondents are IDPs who moved from the occupied territories), and the survey was not conducted with citizens who left abroad after February 24, 2022. Formally, under normal circumstances, the statistical error of such a sample (with a probability of 0.95 and taking into account the design effect of 1.3) did not exceed 4.1% for indicators close to 50%, 3.5% for indicators close to 25%, 2.5% for indicators close to 10%, 1.8% for indicators close to 5%. Under conditions of war, in addition to the specified formal error, a certain systematic deviation is added. Factors that may affect the quality of results in "wartime" conditions were previously cited by KIIS. In general, we believe that the obtained results are still highly representative and allow a fairly reliable analysis of the public moods of the population.
Main results:
Methodological remarks
We usually provide specific methodological information (e.g., detailed question wording, etc.) in the appendices, but in this case, preliminary explanations are necessary. Since 1994, KIIS has been conducting research of the attitude of the Ukrainian population towards certain ethnic and social groups. This research is conducted using the scale of the American sociologist Emory Bogardus (adapted by N. Panina). For each ethnic group from the list, respondents must answer how close a relationship they are ready to admit with representatives of each group. This is called social distance. The minimum social distance is 1 (agree to admit as a family member), the maximum is 7 (would not allow to enter Ukraine). The level of social distance is often interpreted as the level of prejudice against a particular group.
Now I will read you the names of some social and national groups. For each group, say whether you agree to admit its representatives... . Choose all that apply.
Etc., list of groups in the appendix
Survey results. Hierarchy of social distances
Graph 1 shows the social distance (average index obtained using the Bogardus scale) from the population of Ukraine to certain ethnic groups.
Graph 1. Social distance from the adult population of Ukraine to some ethnic groups (Bogardus scale), September-October 2025
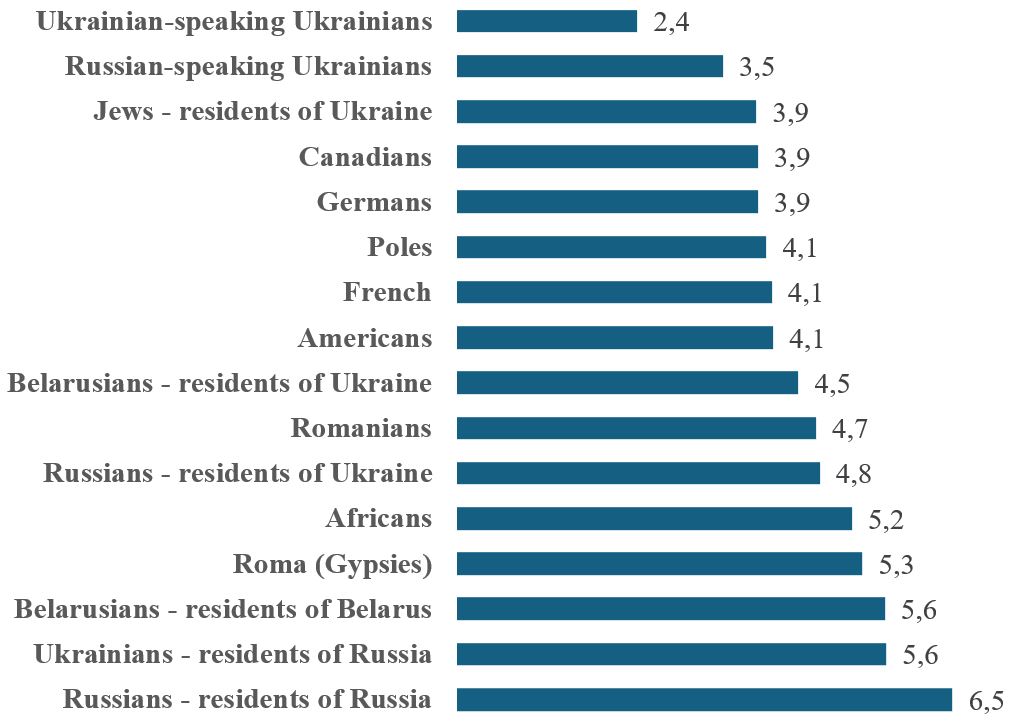
The lowest social distance is towards Ukrainian-speaking Ukrainians (index 2.4) and Russian-speaking Ukrainians (3.5), which indicates the readiness of most respondents to allow representatives of these groups into their closest social contacts – as family members and close friends. Next come Jews-residents of Ukraine, Canadians and Germans (indexes within 3.9), meaning that the attitude towards these groups is quite close and the difference between them is insignificant. The next group is formed by Poles, French and Americans (indexes around 4.0-4.1), followed by Belarusians-residents of Ukraine (4.5) and Romanians (4.7). The highest level of social distance is observed in relation to Russians-residents of Ukraine (4.8), Africans (5.2) and Roma (5.3). Even more distant are Belarusians-residents of Belarus (5.6) and Ukrainians-residents of Russia (5.6). The greatest social distance, as expected in wartime conditions, is towards Russians-residents of Russia (6.5), which is the maximum value among all groups and indicates a very high level of alienation. The vast majority (80%) would not allow Russians even as tourists. If to compare these data with 2022 (see table below), we see that overall social distance towards most ethnic groups has increased, that is, attitudes have deteriorated somewhat. This can be explained by the decrease in the “rallying around the flag” effect and the accumulation of war fatigue. It is known that the worsening situation also affects the increase in the level of interethnic intolerance. The most noticeable increase in social distance is observed towards Poles (+1.1 points). In 2022-2023, the attitude towards Poles was one of the best and remained consistently positive, which was explained by Poland's role as one of Ukraine's key allies after the start of the full-scale invasion. Presumably, the deterioration in attitudes is primarily due to the tension in bilateral relations that arose in 2023-2024. In particular, conflicts around the export of Ukrainian grain had a significant resonance, when Polish farmers blocked the border and opposed the import of Ukrainian agricultural products. These events were widely covered in the Ukrainian media and could form a feeling of unfair treatment by Poland among part of the population. In addition, political discussions between Ukraine and Poland, in particular regarding historical memory (the Volyn tragedy) and some harsh statements by politicians on both sides, could have influenced public moods. Even if these issues are not central to most citizens, their active discussion in the information space could have increased social distance. However, even despite this deterioration, attitudes towards Poles remain significantly better than towards most other groups with higher social distance, and it is unlikely that this is a profound change in basic attitudes – rather a reaction to specific events of recent years. Social distance towards Russian-speaking Ukrainians has increased noticeably (+0.7 points). However, they still remain the closest group to the population of Ukraine after Ukrainian-speaking Ukrainians. To a lesser extent, the changes concerned Canadians and Americans (+0.4 points) and Africans (+0.3 points). The distance to Roma, Romanians and Belarusians - residents of Belarus - also increased slightly (by approximately 0.2-0.3 points). This indicates a certain general increase in social distance even towards groups towards which the attitude was previously more positive or stable. At the same time, for some groups we see a decrease in social distance, i.e. an improvement in attitudes. In particular, this applies to Russians-residents of Ukraine (-0.3 points) and Germans (-0.1 points), although these changes are relatively small. Attitudes towards Jews-residents of Ukraine, Belarusians-residents of Ukraine, and the French changed slightly (within ±0.1-0.15 points), i.e. remained relatively stable. The social distance towards Russians-residents of Russia remains the highest and has practically not changed (an increase of only 0.1 points), which confirms the consistently very high level of alienation towards this group in the context of war. Overall, the results show that after a period of improved attitudes towards allies in 2022-2023, there is a certain general increase in social distance, i.e. an increase in social isolation towards most groups, in the future (until 2025), although these changes remain moderate for many of them.
Table 1. Dynamics of social distance from the adult population of Ukraine to some ethnic groups from September 2022 to September 2025.
To interpret our results, it should be taken into account that some groups live only outside Ukraine (e.g., Americans, French), some live mainly in Ukraine (Ukrainians, Crimean Tatars), and some live both in Ukraine and outside (e.g., Russians, Belarusians). The Bogardus scale, which was adapted in 1994, did not have such a division, and the scale was used without this division until 2022 (this shortcoming was long understood, we even conducted some experiments to compare the results, but we did not want to lose the dynamics over many years). As a result, some respondents previously meant citizens of Ukraine, some - citizens of another state, which complicated the interpretation of the data. As for Russians and Belarusians, this difference did not look unnatural until 2013, 90% of the population of Ukraine had a positive attitude towards Russia and an even larger percentage - towards Russians, they occupied second place in the hierarchy on the Bogardus scale after Ukrainians themselves. In 2022, we divided Russians into residents of Ukraine and Russia, and Belarusians also into residents of Ukraine and Belarus, and the results for these two groups for comparison with the period until 2022 are the arithmetic average of the attitude towards Russians-residents of Russia and Russians-residents of Ukraine, and similarly for Belarusians. As for Jews, we asked only about Jews-residents of Ukraine. In Graph 2, we compare the results of the 1994, 2013 and 2025 survey.
Graph 2. Comparison of social distance from the adult population of Ukraine to some ethnic groups in 1994, 2013 and 2025.
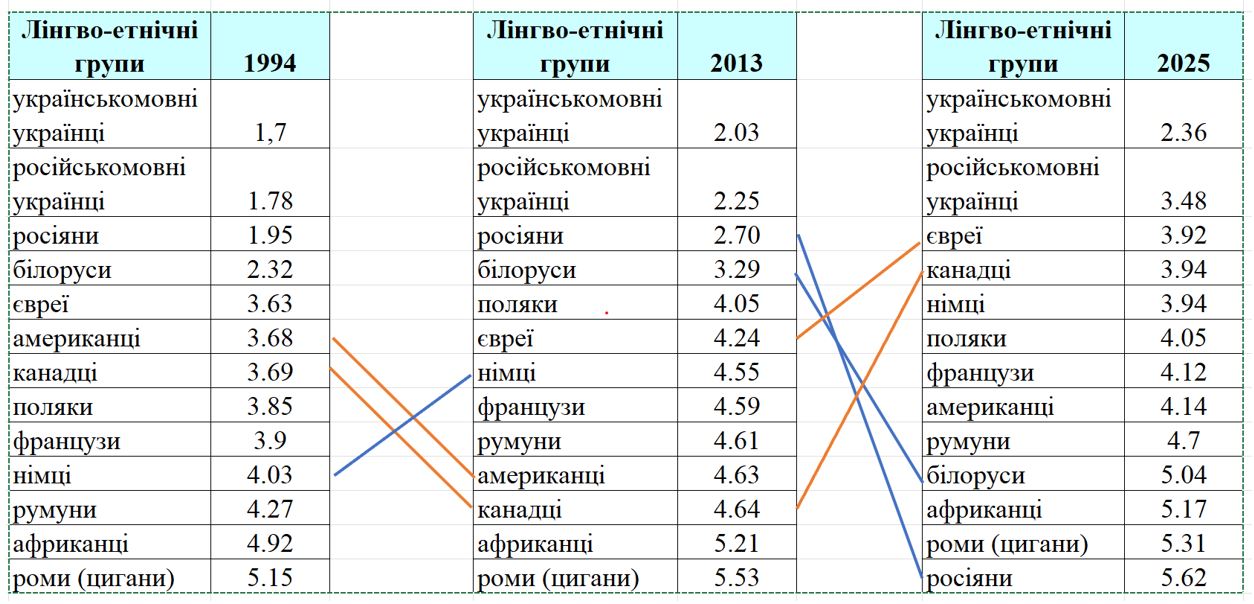 Note: The lines on the graph show ethnic groups that have changed their position in the hierarchy by 3 or more positions.
As we see, both in 1994 and in 2013, the attitude of Ukrainians towards Russians and Belarusians was better than towards all other ethnic groups. It should be noted that it was the best during the entire observation period, more than 25 years, even after 2013, the social distance towards Russians and Belarusians was the smallest after Ukrainians themselves, they occupied 2nd and 3rd place in terms of social distance after Ukrainians. The situation changed only after the full-scale invasion in February 2022. Currently, the attitude towards Russians is the worst among all ethnic groups (more than 80% of respondents do not want to see them even as tourists), and the attitude towards Belarusians is almost the worst (this assessment is the average of the attitude towards Belarusians-residents of Belarus and Belarusians-residents of Ukraine, so this is not the penultimate position; and the attitude towards Belarusians-residents of Belarus, as can be seen from Table 1, is worse than towards all ethnic groups except Russians). We see from Graph 2 that Russians and Belarusians have moved from the beginning of the list to the end, the attitude towards Jews and Canadians has improved significantly, and other ethnic groups have changed their place in the hierarchy by no more than 1-2 positions. The social distance to Russians-residents of Russia is 6.5 with a maximum of 7 (recall, 7 means “would not let them into Ukraine”) and is higher than to any ethnic group in over 30 years of measuring social distance. The distance to Belarusians-residents of Belarus is somewhat lower, but also very high – 5.6 (see Table 1). The social distance has also increased significantly compared to 2013. Unfortunately, the attitude towards Russians and Belarusians-residents of Ukraine has also deteriorated somewhat. The attitude towards Jews-residents of Ukraine has improved since 2013 and now they (along with Canadians and Germans) are the closest to Ukrainians.
Dynamics of xenophobia
Graph 3 shows the dynamics of the xenophobia index, which is calculated as the average social distance to 13 ethnic and linguistic-ethnic groups (in addition, as already mentioned, for Russians and Belarusians in 2022-2025 we used the arithmetic average of distances for residents of Ukraine and residents of Russia, and similarly for residents of Belarus). The name of the index is conditional (it could also be called the tolerance index), we consider this index as an indicator that, although it does not measure xenophobia (or tolerance) directly, is related to the level of xenophobia (in general, xenophobia is a complex multidimensional phenomenon and cannot be characterized by a single indicator).
Graph 3. Dynamics of the level of xenophobia in Ukraine from 1994 to 2025 (average value of social distance for 13 ethnic groups according to the Bogardus scale)
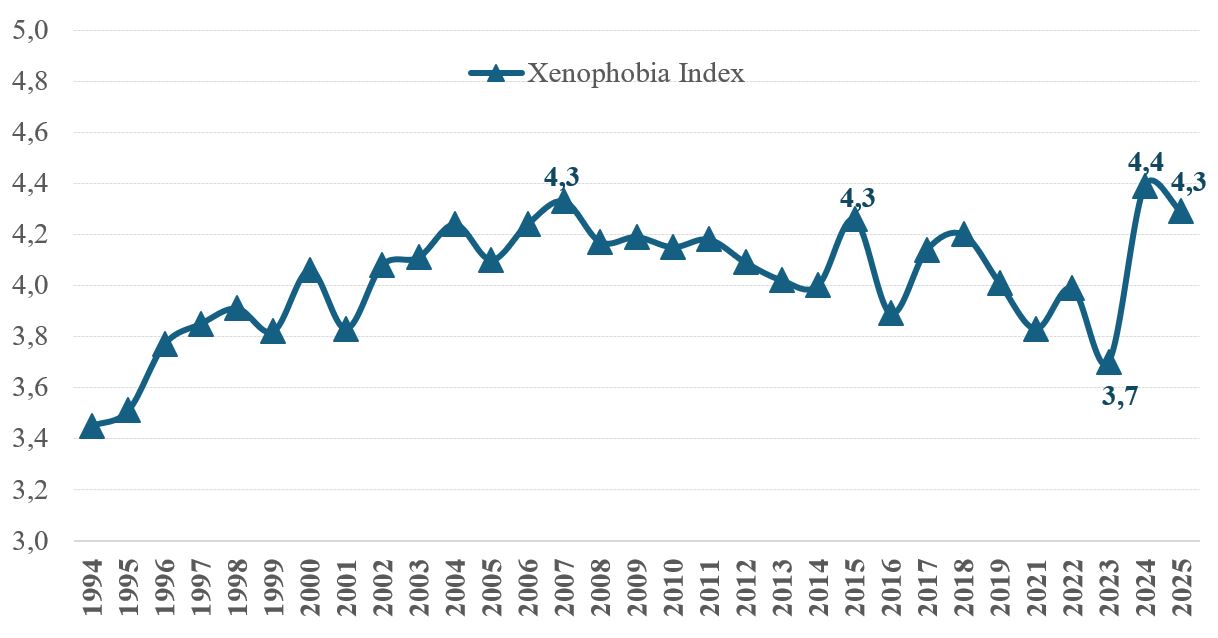 As we see, the level of xenophobia in Ukraine increased with some fluctuations from 1994 to 2007, it increased during this period from 3.5 to 4.3 points. From 2008 to 2013, the index decreased to 4.0 points. Then the xenophobia index fluctuates around this value, in October 2022 it was actually equal to 4 (more precisely 3.99), then it decreased slightly to 3.7, and now it has increased to 4.4[1]. This level is not high, it shows that for most ethnic groups the population of Ukraine maintains a distance of 3, 4 or 5 (i.e. they would not want representatives of these ethnic groups to be members of their families and close friends, but are ready to see them as neighbors, work colleagues and residents of Ukraine). Table D1 in the Appendix contains a breakdown for each ethnic group.
Comment by KIIS President V. Paniotto:As noted in previous years' press releases, the level of xenophobia in Ukraine is not high, but not very low either; the xenophobia index (the average value of social distance) is approximately 4.0. N. Panina and Ye. Holovakha believe that values less than 4.0 indicate openness (tolerance), and values from 4 to 5 indicate national isolation (want to communicate with representatives of their ethnic group in family and with friends, and are ready to communicate with other groups with neighbors and at work). The level of xenophobia in Ukraine as a whole is an average between openness and national isolation. Despite the war, the level of xenophobia in Ukraine remains generally stable. However, attitudes towards Russians-residents of Russia and Belarusians-residents of Belarus have, as expected, deteriorated significantly. What is unexpected is that the attitude towards Russians and Belarusians – residents of Ukraine has also deteriorated. The deterioration of the attitude towards Russian-speaking Ukrainians is also a negative phenomenon. What is the reason for this? Methodological reasons cannot be ruled out. The appendix contains the results of a methodological experiment that shows the sensitivity of the results to the wording of the question. But it is possible that the deterioration of the attitude towards Russians-residents of Ukraine and Russian-speaking Ukrainians is due to the fact that before the start of the large-scale war, there was a higher percentage of those who support pro-Russian parties among them than among Ukrainian-speaking Ukrainians. But now the situation has changed radically. All surveys by KIIS and other sociological companies after February 24, 2022 show that although citizens of Ukraine who are ethnic Russians and Russian-speaking Ukrainians differ somewhat in their views, in fact most of them are completely pro-Ukrainian citizens. For example, most of them also support membership in the EU and NATO. In Ukraine, regional and linguistic-ethnic differentiation has greatly decreased (by some indicators, almost disappeared). The terrible reality quickly dispelled the illusions of Russia's supporters about the possibility of cooperation with this country and made them opponents of Russia and supporters of NATO. Perhaps not everyone is aware of the radical changes that have occurred in our society. We must realize this new reality, our citizens – both ethnic Russians, Russian-speaking Ukrainians, and representatives of other ethnic groups – are fighting shoulder to shoulder with the enemy. The enemy is not among us, but is waging an active information war to sow enmity among us, in particular, between linguistic and ethnic groups. We must closely monitor interethnic relations among Ukrainian citizens in order to counteract negative trends that may reduce the integration of our society.
Appendix 1. Tables For the correct interpretation of the results given in Table D1a, it should be taken into account that there is a certain cumulation for the first 6 points of the scale. If a person agrees that a representative of a particular group should be a member of his family, then, naturally, he agrees even more that he should be a friend, neighbor, colleague, resident or guest of Ukraine. For example, 43% of respondents agree that Americans should be guests of Ukraine. This does not mean that only 43% agree, it means that those who are ready to allow closer relations also agree, that is, the real number of those who agree is equal to: 19%+11%+10%+6%+7%+43=96%. Actually, only 4% disagree. Therefore, below is also table D1b with cumulative percentages, where this is better seen. Each cell contains the percentage of those who are ready to allow this level of relationship and all previous ones.
TableD1а. Distribution of responses regarding ethnic groups, September-October 2025, %
TableD1b- cumulative. Distributions of responses regarding ethnic groups, September-October 2025, cumulative %
TableD3. Xenophobia index (average social distance on the Bogardus scale) by years
Appendix 2. Methodological experiment
In the research was conducted a small methodological experiment aimed at testing how question wording affects assessments of social distance. In the main part of the questionnaire, respondents were asked about their attitude towards: Russians-residents of Russia and Russians-residents of Ukraine. At the same time, in another part of the questionnaire, an alternative wording was used: “citizens of Ukraine who are Russians by nationality.”. Thus, two categories that are similar in content but different in emphasis are compared:
The results are shown in Table D4.
Table D4. Experiment results
The results obtained show that the social distance towards citizens of Ukraine who are Russians by nationality is noticeably lower than towards the formulation “Russians-residents of Ukraine”. In particular:
These results indicate that the wording of the question significantly affects assessments of social distance. Presumably, the wording “citizens of Ukraine who are Russians by nationality” emphasizes civic belonging to Ukraine, which reduces social distance and makes the group “their own” in the eyes of respondents. In contrast, the wording “Russians-residents of Ukraine” may be perceived more ambiguously and more often associated with the broader category of “Russians”, which in wartime conditions has negative connotations associated with the aggressor state. Thus, the results of the experiment show that an emphasis on civic identity reduces social distance, while an emphasis on the ethnonymic category may increase it. This experiment demonstrates an important feature of measuring interethnic attitudes: estimates are sensitive to the wording of questions and can change depending on which aspect of identity – civic or ethnic – is being actualized.
[1] The fluctuations can be partly explained by changes in the accessibility of the occupied territories for the survey. In February 2014, Crimea was still included in the sample, from October 2014 it was no longer included, but certain parts of the occupied Donbas were included (see Appendix 2). In addition, the 2018-2020 research, unlike the previous ones, was conducted not with paper questionnaires, but using tablets, but we hope that this did not have a major impact on the changes in the survey results. But already in 2021, due to the Covid pandemic, we had to switch to a telephone survey, and in the telephone survey the level of education of respondents is slightly higher and therefore the level of xenophobia is lower. In 2022-2025 there was also a telephone survey, which did not include refugees who are abroad.
2.4.2026
|
Our social media:
 KIIS page
 KIIS channel